
Dashboard
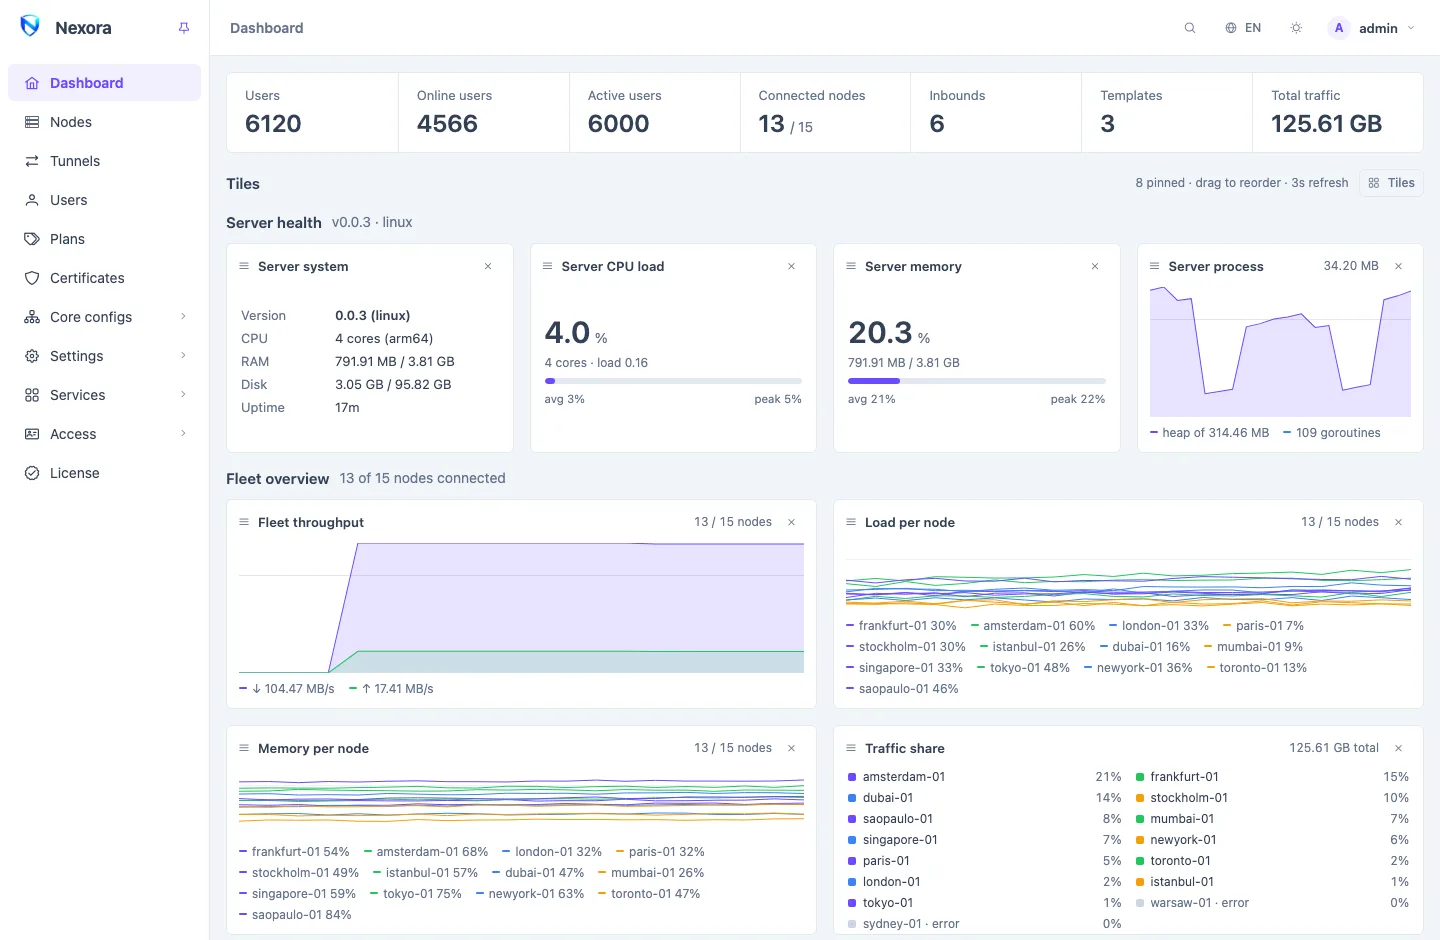
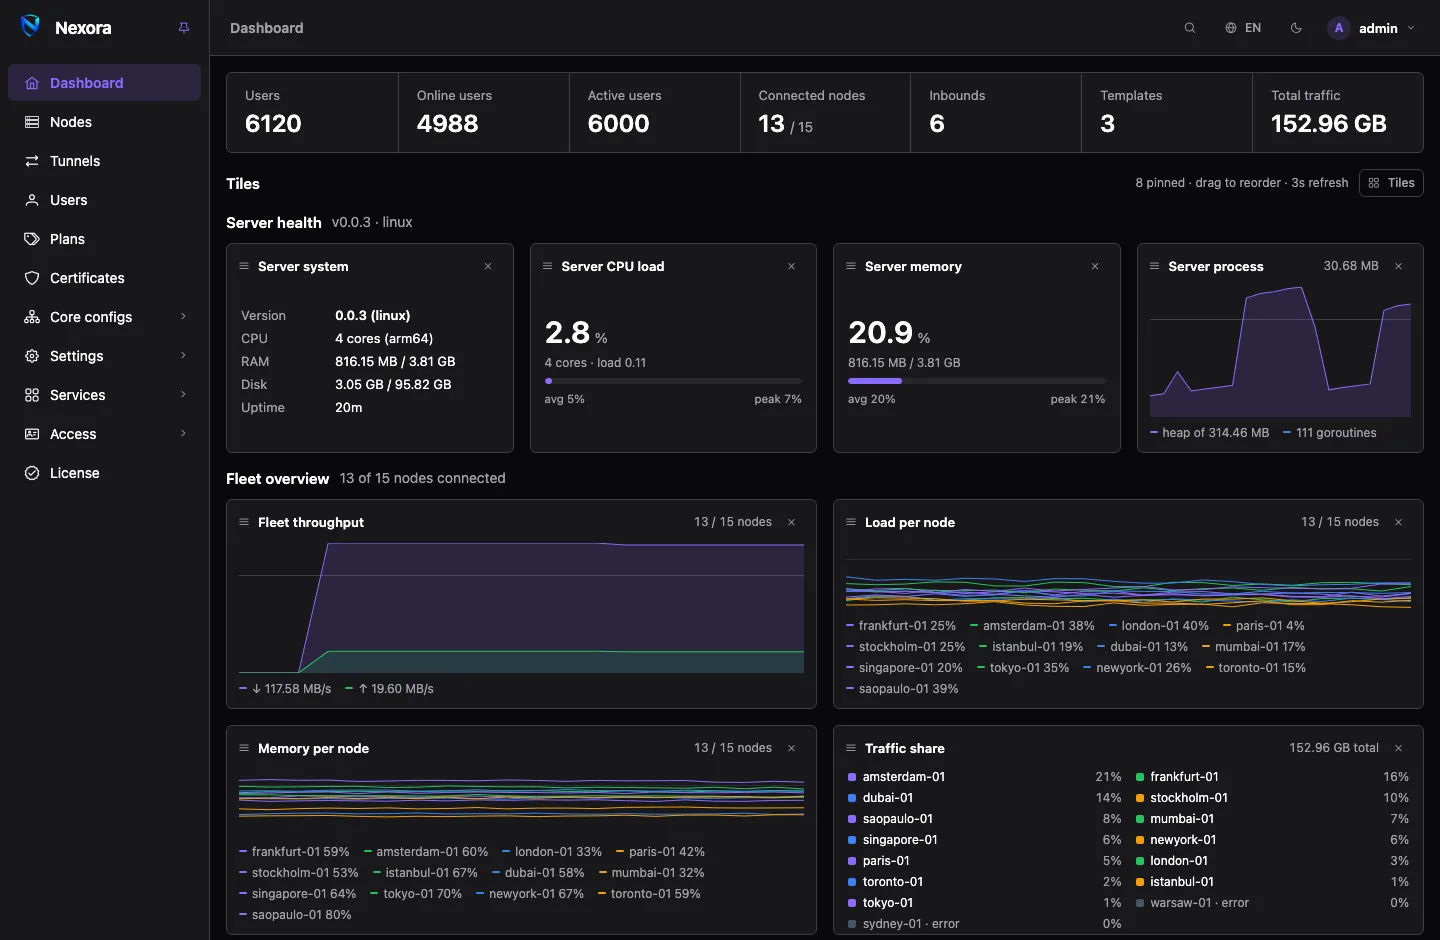
The dashboard is the page the panel opens on. It shows how the panel's own server, your nodes and your users are doing, and you choose most of what it shows.
Getting started
A new panel opens with a Getting started card above everything else. It lists the five things a customer needs before a link works, in order: an inbound, a template that carries it, a node, the template on that node, and a user. Each step links to the page that does it, and a step is ticked once it is true. The card goes away by itself when all five are done, or when you press Hide this guide. Get started walks through the same steps.
The summary strip
The row of counters under the card:
| Counter | What it counts |
|---|---|
| Users | every account you can see |
| Online users | accounts that passed traffic in the last 90 seconds |
| Active users | accounts that are switched on |
| Connected nodes | nodes the panel reaches now, out of all your nodes |
| Inbounds | inbounds in the pool |
| Templates | templates |
| Total traffic | everything every node has carried since it was added |
Tiles
Below the strip are the tiles: small live gauges, charts and readouts. Press Tiles to choose which ones to show. Pinned tiles are saved with your account, so they follow you to any browser; other admins choose their own.
- Drag a tile by its header to move it.
- × in a tile's header unpins it.
- Tiles refresh every few seconds while the page is open. The line beside the Tiles button says how many are pinned and how often they refresh.
A new account starts with the server and fleet tiles pinned. Node tiles start unpinned, because they describe one node and you pick which.
Tiles come in three groups, and the dashboard shows each group in its own section.
Server: the panel's own machine
Shown under Server health, with the panel's version and how it was installed.
| Tile | Shows |
|---|---|
| Server system | the panel's version, CPU cores, memory, disk and uptime |
| Server CPU load | load as a share of the CPU cores, with the average and peak |
| Server memory | memory in use on the panel's server |
| Server process | memory the panel program itself uses |
| Database | the database type and size, the number of usage rows, and how many users, nodes and inbounds it holds |
| Backups | when the last backup was taken, whether automatic backups are on, and how many archives are on the server. The time turns amber when a backup is overdue. |
| License | licensed or free tier, the expiry, and users and nodes used against the cap |
Backups and License are main-admin only: other accounts do not see them in the picker. See Backup and restore and Licence.
Fleet: every connected node
Shown under Fleet overview, with how many of your nodes are connected.
| Tile | Shows |
|---|---|
| Fleet throughput | download and upload across all connected nodes, now and over the last minutes |
| Load per node | one CPU line per node |
| Memory per node | one memory line per node |
| Traffic share | each node's share of all traffic. A node that is not connected is greyed out with its status. |
| Online users | how many accounts are online, against how many exist |
Node: one node at a time
Shown under Live tiles. A row of node names above them picks which node they describe.
| Tile | Shows |
|---|---|
| CPU load, Memory | gauges for that node |
| Load history, Memory history | the same over the last minutes |
| Network | that node's throughput |
| System | the machine: name, address, CPU, load, disk, swap, uptime |
| Nexora node | the node program: running or not, version, uptime, traffic, online users |
A dash (—) in a tile means the node did not report that figure. It does not mean zero.
Node status
The table under the tiles lists every node with its Status, Uptime, memory (RAM), Load and Traffic. Point at a traffic figure to see its upload, download and share of the whole fleet. The Nodes page has the full detail and every action.
| Status | Meaning |
|---|---|
connected | the panel reaches the node and the node serves its configuration |
connecting | the panel is connecting to it |
error | the panel cannot reach the node, or the node refused its configuration. The nodes page shows why. |
disabled | you switched the node off |
Top users by usage
The list beside the table shows the eight accounts with the most traffic. A green dot marks an account that is online now. Click an account to see which nodes it used its traffic on, over a period you pick (Usage by node). This needs the Traffic, reports and health permission.
What a reseller sees
A Reseller gets a different dashboard about its own book only:
- My allowance: traffic used against its volume allowance, what is left, its reset cycle and its account expiry.
- Counters: My users (against its user limit), Online users, Active users and Expiring ≤7d.
- My users: the list of its accounts.
See Resellers.
Related pages
- Nodes: every figure on a node, its health history and its logs.
- Monitoring and metrics: the panel's figures for Prometheus and Grafana, and the host alerts.
- Webhooks and events: alerts when a node's disk or memory fills up.